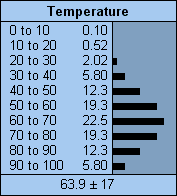

The node form most useful to display the beliefs of a multi-state nature node, or expected utilities of a decision node, is the belief-bar style. Nodes can by displayed in this form by selecting them, and then choosing Style → Belief Bars (choose this with no nodes selected to set the default style of the whole active net).
Each node will be displayed as a box labeled at the top with the node’s name, title or both depending on the node’s labeling.
Examples of a discrete node (left) and a discretized continuous node (right):


The name of each state is shown in the section to the left, along with a number expressing the belief (probability) of that state as a percentage. If the name is too long to fit, it will end with an ellipsis. If the percentage is too small to display numerically, but nonzero, then it will be displayed as “0+”.
Scale: In the section to the right are bar graphs depicting the belief amounts. Vertical dotted lines mark the 25%, 50% and 75% levels. If the node has 4 or less states, then the left edge of the box is 0% and the right edge is 100%, but if there are more states, then the scale may be expanded, so the right edge is less than 100%. If the scale is expanded so much that the right edge is less than 25%, then none of the vertical dotted lines will be visible.
Finding: If the net has been successfully compiled, a finding may be entered into a node just by clicking on the name of its state (and removed by clicking on it again). A negative finding for a node can be entered by holding down the shift key and clicking on the name of the state that its known not to be.
If the node has a positive finding, then the bar for the state corresponding to the finding will be bordered above and below by black lines and the node color will darken to gray (unless you've changed the default node colors). If the color of the node indicates it has a finding, but no bar is surrounded by black lines, then a negative or likelihood finding has been entered.
Mean & Variance: If a node is continuous or has state numbers defined, then its mean value (i.e., expected value) will be shown in a separate area below the belief-bars. The mean value will be followed by a ± symbol and its standard deviation.
Display Fewer States: It is possible to have Netica display only the most probable states, which is very useful for nodes having many states. If you select some nodes, choose Style → Show Only N States, and enter a number, then the display of those nodes will be limited to the N most probable states, ordered from most probable to least. At the bottom will be an entry called "other-" that is the sum total of all the states not displayed. As you enter findings and the beliefs change, then which states are most probable also change, so which states are displayed, and their ordering, changes (if you want their ordering permanently changed by beliefs, see here).
If no nodes are selected when you choose Show Only N States from the menu, then the number you enter will be the default for the whole net. Nodes that have fewer states than the number you enter will be displayed normally (i.e. with all their states in the order you defined). The default for a net before you change it is 50. So if you notice that only 50 states are being displayed for the nodes in your net, you can use this method to change that.
Dimmed: If the belief percentages
and bar lengths are currently invalid for the net’s findings (probably
because the latest findings have not yet been taken into account with
a belief
updating), the bars will be drawn in a grayed or dotted manner.