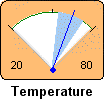
Belief-meters for nodes of continuous variables, or those with state values defined, display a needle which shows the expected value of the node, and bands on the sides of the needle which show the standard deviation, like this:

The number to the left of the scale is the minimum value of the variable, and to the right is the maximum value. Below the meter is the node’s name, title or both depending on the node’s labeling.
How To: Select any continuous nature node and choose Style → Meter. If no nodes are selected when you choose Style → Meter, the default style for the whole net will be set. If the needle has no bands to the sides, or state names appear instead of numbers (like this), it is because the node is discrete.
Finding: If a finding is entered, the background color of the node will be changed to gray (unless you've changed the default node colors). If it is a positive finding, the needle will be all the way to one side, indicating certainty.
Dimmed: If the current position of the needle is invalid for the findings entered (probably because the latest findings have not yet been taken into account with a belief updating), the needle will be drawn gray, or not at all.
Discrete: For a discrete variable
example, click here.