Let’s look at an example of using Netica to do probabilistic inference. In this example we will read in a simple net from a file, compile it into a form suitable for fast inference, enter some findings, and see how the beliefs of various nodes change with each finding.
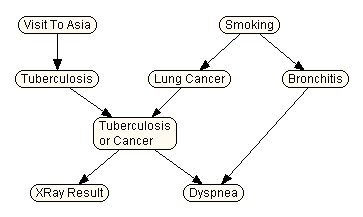
The net we will use is shown below. It is a toy medical diagnosis example from Lauritzen&S88 that has historically been used for demonstration purposes. To a certain degree, the links of the net correspond to causation. The two top nodes are “predispositions” which influence the likelihood of the diseases in the row below them. At the bottom are symptoms for the diseases.

You can read it into Netica by choosing File → Open from the menu (menu selections are indicated in bold, with arrows indicating choices or submenus, so the previous means choose “Open...” from the “File” menu). When the standard file opening dialog box appears, use it to open the file called “Chest Clinic”. This file is included with the Netica distribution in the Examples folder.
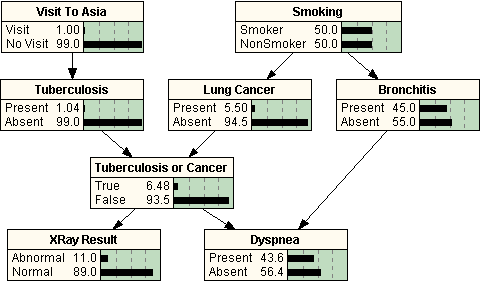
If you compile “Chest Clinic” by choosing Network → Compile, you will see something like the following:

The default node style has changed to belief-bar,
so the display looks different. Also, the appropriate data structures
for fast inference have been built internally. If you enter
a finding of ‘abnormal’ for node “X-Ray Result”, by clicking on the
word ‘abnormal’, the beliefs will be automatically updated, so that the
belief that the patient has lung cancer goes from 5.5% to 48.9%. Then
indicating that the patient has made a visit to Asia decreases that belief
to 37.1%, because the abnormal XRay is partially explained
away by a greater chance of Tuberculosis (which the
patient could catch in Asia).