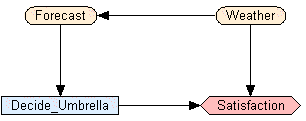
A very tiny decision net from Ross Shachter known as “Umbrella” serves as a good simple example. You can read it into Netica from the Examples folder.
It has 2 nature nodes representing the weather forecast in the morning (sunny, cloudy or rainy), and whether or not it actually rains during the day (rain or no_rain). It has a decision node of whether or not to take an umbrella, and a utility node that measures the decision maker’s level of satisfaction. There is a link from Weather to Forecast capturing the believed correlation between the two (perhaps based on previous observations).

There is a link from Forecast to Umbrella indicating that the decision maker will know the forecast when he makes the decision, but no link from Weather to Umbrella; if he knew for certain what the weather was going to be, it would be easy to decide whether or not to take the umbrella.
There are links from Weather and Umbrella to Satisfaction,
capturing the idea that he is most happy when it is sunny and he doesn’t
take an umbrella (utility = 100), next most when it is raining and he
takes an umbrella (utility = 70). He hates carrying an umbrella
on a sunny day (utility = 20), but is most unhappy if it is raining and
he doesn’t have one (utility = 0). You can examine the utility values
by selecting
node Satisfaction, and then clicking ![]()
To compile this decision net, click ![]() ..
Auto-updating
is turned on for this decision net, so as soon as you compile it, updating
will occur (i.e. it will be “solved”).
..
Auto-updating
is turned on for this decision net, so as soon as you compile it, updating
will occur (i.e. it will be “solved”).
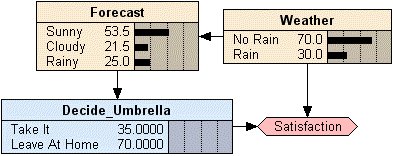
The display will change to something like:

The number beside each decision choice indicates the expected utility of making that choice. So before any information is known, deciding to take the umbrella results in an expected value of 35, while leaving it at home gives 70. Clearly the best choice given the available information is to leave the umbrella at home.
If the decision maker hears that the weather forecast is sunny, then this can be entered by clicking on the word “sunny” of the Forecast node. The expected utilities corresponding to each decision choice change. The best decision is still to leave the umbrella at home, but the expected utility has increased to 91.59, because the extra information indicates it is now more likely that the umbrella won’t be needed.
Say instead the forecast was cloudy. Click on the word “cloudy” to change the finding. Still the best decision is to leave the umbrella at home, but the expected utility has decreased to 65.12, because of the increased chance of rain.
Try a forecast of rainy. The best decision changes to “take the umbrella”, and the expected utility of that decision is 56.
With no findings entered
for node Forecast (since it is the parent node), select node “Decide Umbrella”,
and click on ![]() . The table dialog will open, and there
you can see the optimal decision function, which is to leave it at home
unless the forecast is rainy.
. The table dialog will open, and there
you can see the optimal decision function, which is to leave it at home
unless the forecast is rainy.
For a more advanced example see Car
Buyer. It represents a sequential decision problem (has a later
decision depending on the first), and it has multiple utility nodes.